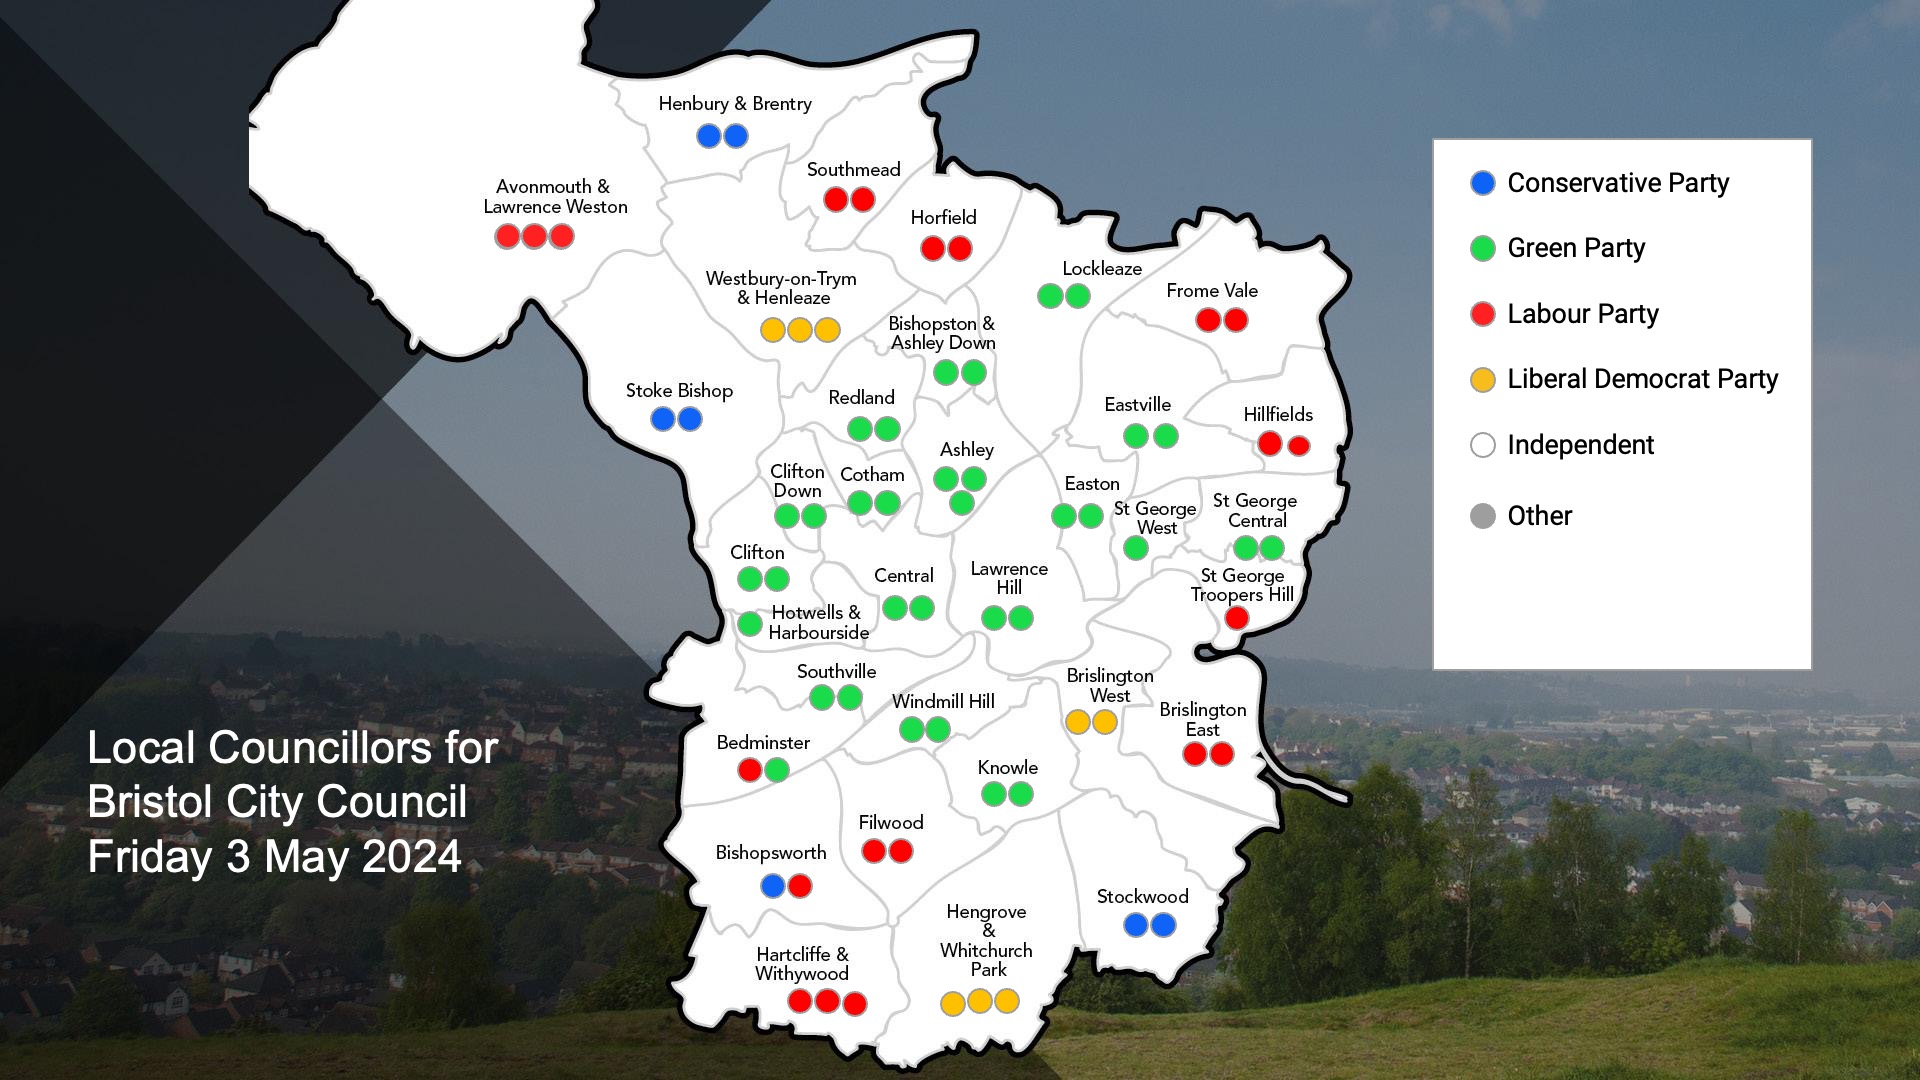
Local councillors election turnout and results by party and by ward.
An election to choose local councillors and the Police and Crime Commissioner (PCC) was held in Bristol on Thursday 2 May 2024.
| Party | Number of councillors |
|---|---|
| Conservative Party | 7 |
| Green Party | 34 |
| Independent | 0 |
| Knowle Community Party | 0 |
| Labour Party | 20 |
| Liberal Democrat | 8 |
| Trade Unionist and Socialist Coalition | 0 |
Results and turnout by ward

Eligible electorate, number of votes cast and turnout by ward
Click on each ward to see detailed results.
| Ward | Eligible electorate | Votes cast | Turnout |
|---|---|---|---|
| Ashley | 14,256 | 6,234 | 43.73% |
| Avonmouth and Lawrence Weston | 15,909 | 4,099 | 25.77% |
| Bedminster | 10,052 | 4,187 | 41.65% |
| Bishopston and Ashley Down | 8,954 | 4,368 | 49% |
| Bishopsworth | 9,337 | 2,614 | 28% |
| Brislington East | 8,890 | 2,690 | 28.17% |
| Brislington West | 8,985 | 3,528 | 39% |
| Central | 8,958 | 2,741 | 30.60% |
| Clifton | 8,883 | 3,493 | 39% |
| Clifton Down | 7,695 | 3,183 | 41.36% |
| Cotham | 7,870 | 3,329 | 42% |
| Easton | 10,124 | 4,239 | 39.70% |
| Eastville | 10,721 | 3,916 | 37% |
| Filwood | 10,084 | 2,130 | 21.49% |
| Frome Vale | 9,958 | 3,105 | 31% |
| Hartcliffe and Withywood | 12,951 | 1,844 | 14.25% |
| Henbury and Brentry | 9,601 | 3,068 | 31.96% |
| Hengrove and Whitchurch Park | 14,789 | 3,689 | 24.94% |
| Hillfields | 9,226 | 2,382 | 25.82% |
| Horfield | 9,259 | 3,059 | 33% |
| Hotwells and Harbourside | 3,869 | 1,538 | 39.75% |
| Knowle | 10,076 | 4,117 | 39.09% |
| Lawrence Hill | 11,667 | 3,515 | 30% |
| Lockleaze | 9,396 | 3,091 | 32.90% |
| Redland | 9,963 | 4,810 | 48.28% |
| Southmead | 9,181 | 2,424 | 26% |
| Southville | 9,684 | 4,054 | 41.86% |
| St George Central | 9,913 | 3,284 | 31.56% |
| St George Troopers Hill | 4,663 | 1,479 | 31.72% |
| St George West | 5,265 | 2,248 | 42.70% |
| Stockwood | 8,956 | 2,475 | 26.34% |
| Stoke Bishop | 8,316 | 3,391 | 41% |
| Westbury-on-Trym and Henleaze | 15,278 | 7,894 | 51.67% |
| Windmill Hill | 10,302 | 4,590 | 47.29% |
